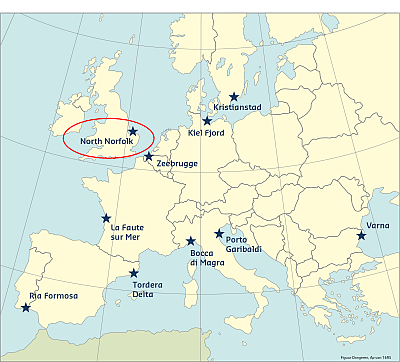
The North Norfolk case study site comprises a 45km long, north-facing coastline, between Old Hunstanton and Kelling Hard, characterised by both gravel and sand barriers, with an extensive (>2,000ha) saltmarsh area behind barrier islands, spits and areas of low-angle sands on open coasts. The barriers support various categories of sand dunes, from embryonic, mobile dunes to fixed dunes, as well as saline lagoons. Landward margins are characterised by brackish reedbeds and freshwater grazing marshes in areas of reclaimed saltmarshes (>800ha). Much of the North Norfolk coast (and almost the entirety of the case study site) falls within the North Norfolk coast Site of Special Scientific Interest.
This case study site was chosen as an example of an area where the natural environment is both a major source of revenue for the local economy via its contribution to tourism and recreational uses, and where the natural environment also plays a role in flood risk reduction from storm surges. This case study site differs from other case study sites due to its relative lack of development and low population density. Nevertheless it provides a good example of how long term shoreline management planning is taking place alongside emergency response planning. The recent storm surge (5-6 December 2013) also provides an opportunity to look at the efficacy of current measures in reducing risk from such extreme events and the resilience of the communities and local economy to such events.
Coast and hazards
This mosaic of habitats is recognised internationally through the North Norfolk Coast Special Area of Conservation(SAC) and as a Special Protection Area (SPA) under the Ramsar Convention. There are important bird reserves at Titchwell and Cley, which attract significant numbers of visitors. Four small river valleys make outfall at the coast. The hinterland is predominantly agricultural with small towns and villages developed around fishing settlements and medieval ports. For the North Norfolk coast the barriers are composed of sand and gravels and vary from supporting relatively high sand dune ridges (in places with plantation forest), to low shell and gravel cheniers.
Ecosystem impacts of major surges are: landward translation of spits and bars; cliffing and retreat of natural dune fields (10-20 m in 1953, 20 m in 1978) on the barrier islands and on the open coast at Thornham and Holkham; formation of storm washover deposits on the barrier island of Scolt Head Island (1953, 1978); breaching of the major gravel barrier between Cley and Salthouse (all large events); flooding of freshwater marshes, ponding of saltwater, loss of invertebrate populations and ‘wash out’ of bird breeding sites; and scouring of plant litter and debris from tidal marshes (although remarkably little damage to marsh surfaces themselves).
Predictability
By the 1960s in the UK there was a move away from statistical models to building numerical models that simulate physical oceanographic processes. Computer-based forecasting began to be developed and the first operational surge forecasts were run in 1978 using a coarse grid. The UK National Tide and Sea Level Facility was established in 2002, with further integration with meteorological forecasting following the extensive UK fluvial flooding of 2007. The current tide-surge model is maintained by the National Oceanographic Centre (Liverpool) and runs in real-time at the UK Met Office. A 12 km resolution shelf model (CS3X) is forced by 12 km grid meteorological data from the Met Office North Atlantic European (NAE) weather forecasting model. Results are transmitted to the UK Environment Agency and used, together with data from the National Tide Gauge network, for flood warnings.
Surge models are run four times per day, producing forecasts up to 2 days ahead. The model surge is combined with tides predicted at tide gauge sites to give the best estimate of the total water level. Model performance is routinely monitored at the National Oceanography Centre, Liverpool by comparing forecast results with observations every month. Typical root-mean-square errors are about 10cm. An archived forecast is available, including real-time observations minus astronomical tidal predictions.
Historical flood events
Twenty high water events are recognised along the North Norfolk coast and/or on adjacent coasts since 1883; fifteen of these events resulted in flooding. Sea flooding is associated with the combination of high spring tides and storm surge, often with additional run-up from onshore storm waves. Impacts on lives and livelihoods include extensive flooding of reclaimed marshes and loss of agricultural production; saltwater intrusion into coastal valleys; flooding of coastal settlements with disruption to shops and businesses (often related to recreational tourism) in larger settlements; disruption to inshore fisheries and local shellfish industry; disruption to port activities at Wells-next-the-Sea; road flooding, including closure of main W-E road network; and flooding/destruction of footpaths along the coast.
In both 1953 and 1978 there was major breaching of the substantial sea defence along the western margin of the Wells Harbour channel. In the catastrophic storm surge of 31 January – 1 February 1953, 81 lives were lost in Norfolk, although the greatest concentration of mortality (65 lives lost) was to the west of the study area, at Hunstanton and Snettisham, as a result of much fragile single-storey housing, poor escape routes across low-lying ground and strong onshore winds and waves. Nationally, the cost of the damages to the defences in 1953 was estimated at the time to be ca. £30 million to the UK economy (over £700 million at 2013 prices). In addition, telephone lines, electricity, gas, water, sewage and drainage were disrupted; 24,000 houses and over 200 industrial premises needed repairs; and 32,000 people were evacuated. 160,000 acres of land were flooded by salt water and 46,000 livestock died. The lack of deaths in the comparably high surge of 5 December 2013 has been attributed to post-1953 strengthened defences, improvements in storm forecasting and co-ordinated crisis management plans, including the early warning system and the provision of evacuation centres. In the 2013 event, 10 residential properties and 13 businesses were flooded in Wells; the comparable figures in Blakeney / Cley / Salthouse were 30 and 14.
This information has been extracted from the RISC-KIT "Review report of key challenges and lessons learned from historical extreme hydro-meteorological events".
The datasets on storms are available for download from the project’s historical storm database.